You run a PageSpeed Insights test on your WordPress site and get a score of 85 on desktop. You feel pretty good about that. Then you check Google Search Console and it’s still showing URLs as “Poor” or “Needs Improvement” in the Core Web Vitals report. You run the test again. Still 85. Still failing in Search Console.
If that’s you, you’re not doing anything wrong — you’re just measuring the wrong thing. And you’re not alone. This is the single most common source of confusion around Core Web Vitals, and most guides never explain it clearly.
This guide is part of the Technical SEO: The Complete Guide series and covers everything you need to understand about Core Web Vitals as a WordPress site owner — what they actually measure, why your scores might look different across tools, what specifically causes poor scores on WordPress sites (including page builder sites like Divi), and a prioritised sequence for fixing them that focuses on what actually moves the needle rather than chasing a number in a lab test.
What Are Core Web Vitals?
Core Web Vitals are three specific metrics Google uses to measure how real users experience your website. Not how fast it loads in a test environment, but how it actually feels to a real person visiting your site on their phone or laptop, on their actual internet connection, in the real world.
Google introduced Core Web Vitals in 2020 and made them an official ranking signal in 2021. They’ve been a confirmed part of Google’s page experience ranking factors ever since, and their weight as a ranking signal has grown with each algorithm update.
The three metrics are:
- LCP — Largest Contentful Paint: How fast does your main content appear?
- INP — Interaction to Next Paint: How quickly does your page respond when someone interacts with it?
- CLS — Cumulative Layout Shift: Does your page layout stay stable while loading, or do elements jump around?
Each metric has a pass/fail threshold — Good, Needs Improvement, or Poor — and Google evaluates your site using real user data collected from Chrome browsers, not synthetic lab tests.
Why does PageSpeed show 85 but Search Console says Poor?
Because:
- PageSpeed uses lab data (simulated)
- Search Console uses real user data (field data)
- Real users have slower devices, networks, and conditions
The Most Important Thing to Understand Before We Go Further
Core Web Vitals are measured using field data — real user measurements collected by Google through the Chrome User Experience Report (CrUX). This data reflects what actual visitors experience on your site, primarily on mobile devices.
PageSpeed Insights, Lighthouse, and GTmetrix run lab tests — simulated measurements from a controlled environment. Lab tests are useful for diagnosing what to fix, but they are not what Google uses to rank your site.
This is why your PageSpeed score can be 85 while Search Console still shows poor Core Web Vitals. The lab test looks at your site from a fast simulated connection in a data centre. Your real visitors are on slower mobile connections, older phones, and varying network conditions. Their experience is what counts.
When I talk about improving Core Web Vitals in this guide, the goal is improving your field data scores in Search Console — not chasing a number in PageSpeed Insights.
The Three Core Web Vitals Explained
LCP — Largest Contentful Paint
LCP measures how long it takes for the largest visible element in the viewport to finish loading. This is usually your hero image, featured image, or main heading — whichever element takes up the most visual space above the fold.
Google uses LCP as a proxy for “when does this page feel loaded?” If the biggest thing on the screen takes 4 seconds to appear, the page feels slow even if everything else loaded quickly.
Good: Under 2.5 seconds
Needs Improvement: 2.5 to 4 seconds
Poor: Over 4 seconds
On most WordPress sites, LCP is the hardest metric to pass consistently — particularly on mobile — because it’s affected by server speed, image optimisation, render-blocking resources, and how your theme or page builder loads its first visible content.
Common LCP elements on WordPress sites:
- Hero section background image set via CSS
- Featured image in a blog post
- Large header image or banner
- Above-the-fold text block in a page builder layout
One important note: lazy loading applied to the LCP element is one of the most common causes of poor LCP. WordPress 5.5+ added native lazy loading, but it should never be applied to the LCP image. The LCP image should load immediately, not wait until the browser decides to fetch it.
INP — Interaction to Next Paint
INP replaced First Input Delay (FID) as an official Core Web Vital in March 2024. If you’re reading a guide that still talks about FID as a current metric, it’s outdated.
INP measures how quickly your page visually responds after a user interaction — a click, a tap, or a keyboard input. It measures the entire cycle: the user interacts, the browser processes it, and the screen visually updates. INP captures the slowest interaction across a user’s entire visit, not just the first one.
Good: Under 200 milliseconds
Needs Improvement: 200 to 500 milliseconds
Poor: Over 500 milliseconds
Most WordPress sites pass INP more easily than LCP, but it becomes a problem when pages have heavy JavaScript — particularly from page builders, third-party scripts (chat widgets, advertising pixels, marketing tools), and complex interactive elements.
On Divi specifically, the Visual Builder and some Divi modules load JavaScript that can contribute to INP issues on pages with complex layouts or many interactive elements. Divi 5 has significantly improved performance over Divi 4 in this area, but it’s worth monitoring on complex page templates.
CLS — Cumulative Layout Shift
CLS measures visual stability — how much your page layout shifts unexpectedly while loading. If you’ve ever started reading something on a page and the text suddenly jumps down because an image loaded above it, that’s a layout shift. If a button you were about to tap suddenly moved because an ad loaded, that’s a layout shift.
CLS is scored differently from LCP and INP. Instead of time-based measurements, it’s a unitless score representing the cumulative impact of all unexpected layout shifts during the page load.
Good: Under 0.1
Needs Improvement: 0.1 to 0.25
Poor: Over 0.25
Common causes of CLS on WordPress sites include images without explicit width and height attributes (the browser doesn’t know how much space to reserve before the image loads), fonts that cause text to reflow when they load (FOUT — Flash of Unstyled Text), elements injected by plugins after page load (cookie banners, chat widgets, promotional bars), and ads or embeds without reserved dimensions.
CLS is often the easiest of the three metrics to fix on WordPress sites once you know what’s causing it.
What Realistic Core Web Vitals Look Like for a WordPress Site
I want to address something that many guides skip: what scores are actually achievable on a real WordPress site with a page builder, multiple plugins, and normal hosting?
Chasing a 100 score in PageSpeed Insights is not a realistic goal for most WordPress sites, and it’s not what Google requires. Google’s threshold for a “Good” experience is:
- LCP under 2.5 seconds
- INP under 200 milliseconds
- CLS under 0.1
These are achievable on a well-optimised WordPress site with a quality page builder and decent hosting. A site running Divi 5 with LiteSpeed hosting, a properly configured caching plugin, and optimised images can and does pass all three metrics with scores in the green.
A perfect 100 in PageSpeed Insights is typically only achievable on very minimal sites without page builders, few plugins, and minimal JavaScript. That’s not the reality of most client or business sites, and Google doesn’t expect it.
The goal is: pass all three Core Web Vitals in Google Search Console’s field data. Everything else is diagnostic information to help you get there.
How to Check Your Core Web Vitals
There are two categories of tools — field data tools (what actually matters for ranking) and lab tools (useful for diagnosis).
Field Data Tools — These Reflect Your Real Ranking Signals
Google Search Console — Core Web Vitals Report
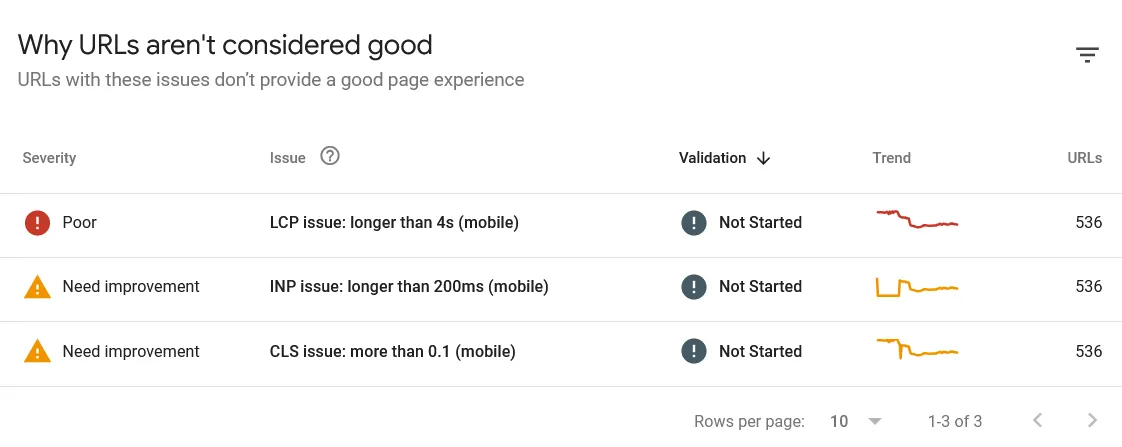
This is the most important tool. Go to Google Search Console → Core Web Vitals (under Experience in the left menu). You’ll see two reports — Mobile and Desktop — showing which URL groups are Good, Need Improvement, or Poor.
This data comes from real Chrome users visiting your site. It updates with a 28-day rolling window, which means changes you make today won’t fully reflect in this report for up to 28 days. This is why Core Web Vitals improvement feels slow — you’re not seeing lab results, you’re waiting for real user data to accumulate.
If your site doesn’t have enough traffic, Google may not have sufficient field data to generate a report. In that case, you’ll see “Not enough data” — and you’ll need to rely on lab tools until your traffic grows.
PageSpeed Insights — Field Data Section
When you run a URL through PageSpeed Insights (pagespeed.web.dev), the top section shows field data from CrUX if available for that URL. Scroll down and you’ll also see the lab test results. Always check the field data section first — it’s marked “Discover what your real users are experiencing.”
Lab Tools — Use These for Diagnosis, Not for Reporting to Clients
PageSpeed Insights — Lab Data Section
The lower section of PageSpeed Insights shows lab-simulated results and specific recommendations. This is where you find actionable fixes — which images need optimisation, which scripts are render-blocking, which resources are delaying LCP. Use this to find what to fix, not to measure success.
Google Chrome DevTools — Lighthouse
Press F12 in Chrome, go to the Lighthouse tab, and run a Performance audit. This gives you the same lab simulation as PageSpeed Insights plus more detailed waterfall charts showing exactly how your page loads. Useful for deep diagnosis.
Chrome DevTools — Performance tab
For diagnosing INP issues specifically, the Performance tab’s interaction recording shows you exactly which JavaScript functions are causing slow responses to user clicks and taps.
web.dev/measure
Google’s own testing tool — similar to PageSpeed Insights but with slightly different presentation. Useful for a quick overview of all metrics in one place.
Why WordPress Sites Struggle With Core Web Vitals
WordPress is not inherently slow. But its open architecture — themes, page builders, plugins, third-party scripts — creates compounding performance issues that other platforms don’t have.
Here are the specific reasons WordPress sites struggle, and why each matters:
Server Response Time (TTFB)
Time to First Byte (TTFB) is how long the server takes to send the first byte of a response after a browser requests a page. It’s not officially a Core Web Vital, but it’s the foundation everything else builds on.
WordPress is a dynamic CMS. Every page request triggers PHP execution and a MySQL database query. On cheap shared hosting, hundreds of sites share the same server resources — when multiple sites spike in traffic simultaneously, server response time degrades for all of them. TTFB of 800ms to 1500ms is common on shared hosting under load. That alone makes passing LCP nearly impossible regardless of how well you’ve optimised everything else.
Good TTFB for Core Web Vitals: under 600ms. Excellent: under 200ms. This is primarily determined by your hosting environment, not by WordPress optimisation.
Render-Blocking Resources
WordPress themes and plugins frequently load CSS and JavaScript files in the <head> of the page — meaning the browser has to download and process these files before it can render anything visible. Every render-blocking resource is a delay before your LCP element can appear.
Common sources of render-blocking resources on WordPress sites:
- Theme stylesheets loaded synchronously
- Page builder CSS files (Divi, Elementor, WPBakery)
- Plugin scripts that load globally on every page even when not needed
- Google Fonts loaded via a standard link tag instead of preloaded
- jQuery loaded in the head rather than deferred
Unoptimised Images
Images are typically the LCP element and are often the heaviest resources on a WordPress page. An uncompressed hero image uploaded from a camera or design tool — sometimes 2-5MB in size — will make LCP fail regardless of everything else you do.
Common image issues on WordPress sites:
- Oversized images (uploading a 4000px wide image for a 800px wide column)
- Uncompressed JPG or PNG instead of WebP
- LCP image marked as lazy-load (it should be preloaded, not lazy loaded)
- Background images set via CSS that the browser discovers late in the loading process
- No explicit width and height attributes causing layout shifts (CLS)
Too Much JavaScript
JavaScript is the primary cause of INP issues and contributes significantly to LCP. Modern WordPress sites — particularly those using page builders, WooCommerce, membership plugins, and marketing integrations — can easily load 1-3MB of JavaScript on a single page.
Every JavaScript file requires downloading, parsing, and executing before the browser’s main thread is free to respond to user interactions. The more JavaScript, the slower the response to clicks and taps, and the higher the INP score.
Web Fonts
Custom fonts are a surprisingly significant source of both LCP delay and CLS. When the browser loads a page, it initially renders text in a system font, then swaps to the custom font when it downloads — causing a Flash of Unstyled Text (FOUT) that contributes to layout shift. The font loading itself also delays LCP if it’s on the critical rendering path.
Third-Party Scripts
Analytics tags, chat widgets, advertising pixels, social share buttons, marketing automation scripts — every third-party script you load adds latency, consumes main thread time, and contributes to INP. These scripts are loaded from external servers you don’t control, so their performance varies with those servers’ availability and speed.
Common Core Web Vitals Mistakes
- Chasing PageSpeed score instead of field data
- Lazy loading the LCP image
- Using too many plugins/scripts
- Ignoring mobile performance
- Testing only once
How to Improve Core Web Vitals on WordPress — In Priority Order
This sequence matters. Most guides list optimisations in no particular order, which leads to spending hours on fixes that move the needle very little. Work through these in order — the earlier steps have the highest impact.
Step 1: Fix Your Hosting First
If your TTFB is consistently above 600ms, no amount of WordPress optimisation will get you to a reliable “Good” LCP in field data. Your hosting is the foundation.
This doesn’t mean you need the most expensive hosting available. For most WordPress sites — including business sites, portfolios, and blogs — a quality shared hosting plan with server-side caching enabled is sufficient. The key characteristics to look for:
- LiteSpeed web server — significantly faster than Apache for WordPress, with native LiteSpeed Cache integration
- PHP 8.2 or 8.3 — newer PHP versions are measurably faster than 7.x or 8.0
- Server-side caching — the host caches WordPress pages at the server level, bypassing PHP and database queries for cached pages
- A nearby data centre — choose a hosting provider with a server location closest to your primary audience. If most of your visitors are in India, a server in Singapore or Mumbai will deliver lower TTFB than one in the US or Europe
Hostinger’s LiteSpeed-based hosting performs well for Core Web Vitals for most WordPress sites in this regard — server-side caching is included and the LiteSpeed Cache plugin integrates directly with it.
Step 2: Configure a Caching Plugin Properly
Caching stores a pre-generated version of your WordPress pages so PHP and the database don’t have to run on every visit. A properly configured caching plugin is the single biggest WordPress-level improvement you can make for LCP.
LiteSpeed Cache (free) — if you’re on LiteSpeed hosting (Hostinger, NameHero, Cloudways with LiteSpeed), this plugin integrates directly with the server. Enable page caching, browser caching, CSS and JS minification, and image optimisation. The QUIC.cloud CDN integration is also available for free with LiteSpeed Cache.
WP Rocket (paid) — the most popular premium caching plugin. Handles page caching, browser caching, render-blocking resource deferral, critical CSS generation, and lazy loading in one plugin with minimal configuration. A good option if you’re not on LiteSpeed hosting.
W3 Total Cache or WP Super Cache (free) — functional but require more manual configuration and don’t include the frontend optimisation features of LiteSpeed Cache or WP Rocket.
Key caching settings to enable regardless of which plugin you use:
- Page caching — most important
- Browser caching — cache static resources in the visitor’s browser
- GZIP or Brotli compression — compress responses before sending them
- CSS and JS minification — remove whitespace and comments from these files
- Database caching — cache frequent database queries
Step 3: Optimise Your Images
Images are almost always involved in LCP issues and frequently cause CLS. These are the image fixes that actually move the needle:
Convert to WebP format. WebP files are 25-35% smaller than JPG and PNG for equivalent visual quality. Most modern browsers support WebP natively. Either convert images to WebP before uploading (tools like Squoosh or TinyPNG do this for free), or use an image optimisation plugin that converts automatically.
Compress images before uploading. Aim for under 150KB for most images, under 300KB for large hero images. Uploading a 3MB hero image and relying on WordPress to resize it is not sufficient — the original file is still being served in many cases.
Set explicit width and height on all images. This tells the browser how much space to reserve before the image loads, preventing CLS. WordPress does this automatically for images added through the media library, but manually added images or images set via CSS may not have these attributes.
Fix lazy loading on the LCP image. Your LCP image — typically your hero image or the featured image at the top of a post — should never have loading="lazy". It should load immediately. In Divi, check your Section or Row background image settings and ensure “Lazy Load” is disabled for above-the-fold images. For featured images, WordPress 5.9+ applies loading="lazy" automatically to all images except the first one — but verify this is working correctly on your theme.
Preload the LCP image. Add a preload hint in your <head> for the LCP image so the browser discovers and starts downloading it as early as possible. In Divi with LiteSpeed Cache, you can specify the LCP image URL in the LiteSpeed Cache settings. With WP Rocket, the Preload section handles this.
Use an image optimisation plugin. ShortPixel, Imagify, and Smush all automatically compress and convert images on upload. ShortPixel’s free tier (100 images/month) is sufficient for most small sites.
Step 4: Eliminate Render-Blocking Resources
Render-blocking CSS and JavaScript delay the moment the browser can paint anything on screen — directly impacting LCP. The goal is to ensure critical CSS loads first and non-critical CSS and JavaScript loads after the initial render.
Defer non-critical JavaScript. JavaScript that isn’t needed for the initial page render should be deferred — loaded after the page is visible. LiteSpeed Cache, WP Rocket, and most performance plugins have a “Defer JS” setting. The catch: some plugins (contact forms, sliders, interactive elements) need their JavaScript to load normally. Test carefully after enabling JS deferral — broken interactive elements are the most common side effect.
Load CSS asynchronously. Non-critical CSS (styles for elements below the fold) should be loaded asynchronously rather than blocking the render. Performance plugins handle this automatically by generating “critical CSS” — the minimum CSS needed to render the above-the-fold content — and loading everything else asynchronously.
Preload key resources. The LCP image, critical fonts, and key CSS files should be preloaded using <link rel="preload"> tags so the browser fetches them as early as possible.
Reduce Google Fonts latency. Google Fonts loaded via a standard link tag are a common render-blocking resource. Options: preconnect to fonts.googleapis.com, use font-display: swap to prevent render blocking while fonts load, or host fonts locally on your server (the fastest option). LiteSpeed Cache has a Google Fonts optimisation setting. WP Rocket’s Preload section also handles font preloading.
Step 5: Reduce JavaScript Load
Reducing the amount of JavaScript that loads and executes on your pages is the primary fix for INP issues and also helps LCP.
Disable plugins on pages where they’re not used. Many plugins load their scripts globally on every page even when they’re only needed on specific pages. A contact form plugin loading its scripts on your blog posts, for example, adds unnecessary JavaScript load. The Perfmatters plugin provides per-page script control, letting you disable specific plugins on specific pages. Asset CleanUp is a free alternative.
Audit your plugins for unused JavaScript. Open Chrome DevTools → Coverage tab (Ctrl+Shift+P → type “coverage”) and run a page load. This shows you what percentage of each JavaScript file is actually used on that page. Files with over 80% unused code are candidates for removal or conditional loading.
Be selective with third-party scripts. Each analytics tool, chat widget, A/B testing script, and marketing pixel you add loads JavaScript from an external server. Audit what you actually need. A site loading Google Analytics, Facebook Pixel, a chat widget, a Hotjar recording, and a cookie consent script is loading 4-5 external scripts that collectively block the main thread significantly.
Load third-party scripts after user interaction. For non-critical scripts like chat widgets, consider loading them only after the user first interacts with the page (scrolls, clicks, moves the mouse). WP Rocket’s “Delay JavaScript execution” feature does this automatically for specified scripts. This dramatically improves initial INP scores.
Step 6: Fix Layout Shift (CLS) Issues
CLS is often the quickest metric to fix once you identify the source. Check your PageSpeed Insights report for the “Avoid large layout shifts” item — it often lists the specific elements causing shifts.
Add explicit dimensions to all images and embeds. Every image, video embed, iframe, and ad unit should have explicit width and height attributes. This tells the browser how much space to reserve during load, preventing content from jumping when these elements finish loading.
Fix font loading. Add ‘font-display: swap’ to your custom font declarations so text renders in a fallback font immediately rather than staying invisible until the custom font loads. This prevents the invisible-to-visible text jump. If fonts are causing significant shifts, consider hosting them locally — locally-hosted fonts load faster and with less layout shift than fonts loaded from Google’s servers.
Reserve space for dynamic elements. Cookie consent banners, notification bars, chat widgets, and newsletter popups are common CLS culprits because they inject content that pushes other elements down. Set explicit height reservations for these elements, or load them in a way that doesn’t affect the document flow (fixed positioning, for example, doesn’t affect CLS).
Check your Divi modules for CLS. Some Divi modules — particularly sliders, image galleries, and modules that load content dynamically — can cause layout shifts. Test individual page templates in PageSpeed Insights to identify which modules contribute to CLS.
Core Web Vitals and Divi — Specific Considerations
Since Divi is a popular choice among WordPress web designers, it’s worth addressing the specific CWV considerations.
Divi 5 made significant performance improvements over Divi 4, including a refactored CSS delivery system and reduced JavaScript footprint. However, building a Divi site that consistently passes Core Web Vitals field data requires attention to a few specific areas.
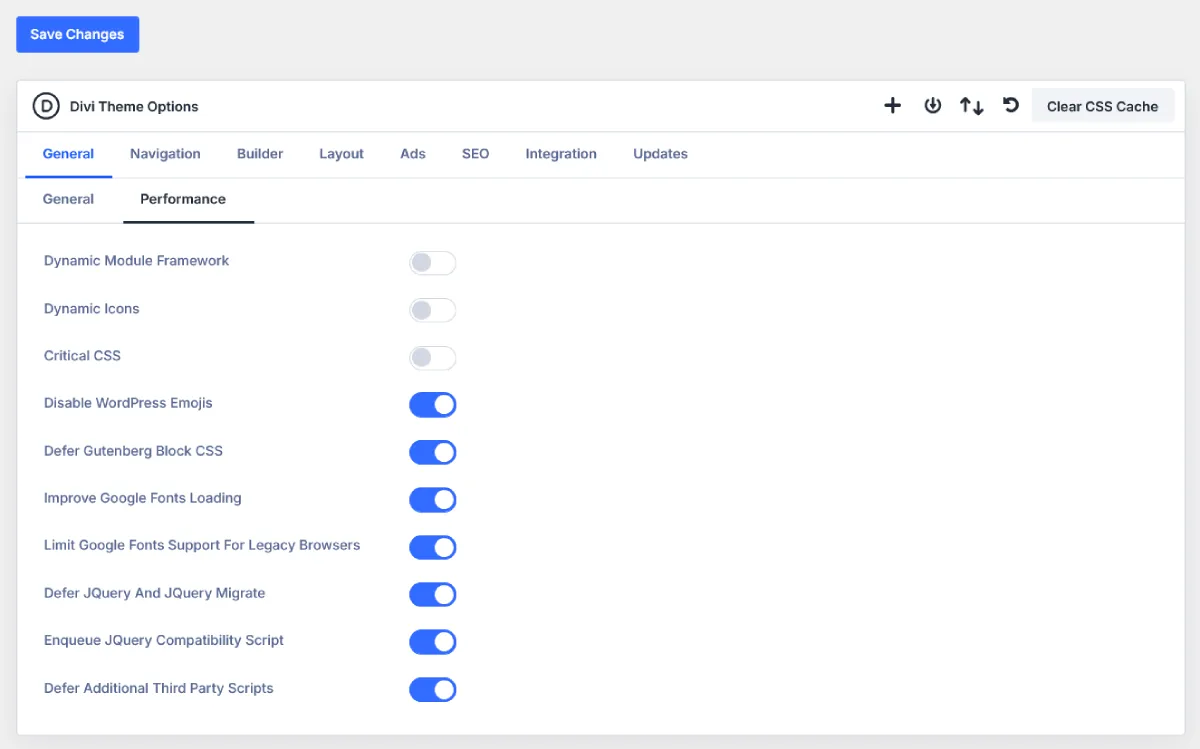
Divi’s CSS generation. Divi generates dynamic CSS for each page based on the modules and settings you’ve used. With Divi 5’s improved static CSS generation, this is less of an issue than it was in Divi 4, but it’s worth checking whether your theme is serving dynamic or static CSS. In Divi’s Theme Options → Performance, enable static CSS file generation.
Background images as LCP elements. Divi sections with full-width background images are common on business sites and landing pages. CSS background images are discovered later in the loading process than inline <img> tags, which can delay LCP. If your hero section uses a Divi section background image as the LCP element, add a preload tag for that image in your theme’s <head>. LiteSpeed Cache’s LCP configuration can handle this, or you can add it manually via a snippet in your theme’s header.
Divi’s JavaScript on complex pages. Pages with many Divi modules — especially interactive ones like accordions, tabs, toggles, and sliders — load more JavaScript than simple page layouts. If INP is failing on specific pages, check whether reducing module complexity or combining sections improves the score.
Divi image handling. Divi adds its own image handling layer on top of WordPress. Verify that lazy loading is not applied to above-the-fold images in your Divi section and module settings, and that image compression is handled at the upload stage or via an optimisation plugin rather than relying on Divi’s own handling.
How to Track Core Web Vitals Improvements Over Time
Because Core Web Vitals field data updates on a 28-day rolling window, you need patience and a systematic tracking approach.
After making changes, note the date and what you changed. This sounds obvious but many site owners make multiple changes simultaneously and can’t tell what worked. Change one major thing at a time — fix image optimisation first, verify with lab tools, wait a week, check Search Console. Then move to the next fix.
Check Google Search Console weekly. The Core Web Vitals report shows trend lines over time. After significant optimisations, you should see the failing URL groups shrinking and scores improving over 2-4 weeks.
Use PageSpeed Insights for immediate feedback. After making a change, run PageSpeed Insights to verify the lab data improved. If the lab score got better, the field data should follow over the next few weeks — if it doesn’t, the real-world conditions are different from the lab conditions and there’s more to fix.
Check both mobile and desktop. Google primarily evaluates mobile Core Web Vitals for mobile-first indexing. A site that passes on desktop but fails on mobile still counts as failing. Always test and optimise for mobile first.
Monitor after publishing new content. Adding new images, embedding videos, or installing new plugins can degrade previously passing Core Web Vitals. Build a habit of running a PageSpeed Insights check after significant content additions or plugin updates.
Core Web Vitals Quick Reference
| Metric | Measures | Good | Needs Improvement | Poor | Primary Fix |
|---|---|---|---|---|---|
| LCP | Loading speed of main content | Under 2.5s | 2.5s – 4s | Over 4s | Image optimisation, hosting, caching, preload LCP image |
| INP | Response to user interactions | Under 200ms | 200ms – 500ms | Over 500ms | Reduce JavaScript, defer non-critical scripts |
| CLS | Visual stability during load | Under 0.1 | 0.1 – 0.25 | Over 0.25 | Image dimensions, font-display: swap, fix dynamic elements |
Related reading: Technical SEO Audit Checklist for WordPress | Website Architecture for SEO
Frequently Asked Questions
Do Core Web Vitals directly affect Google rankings?
Yes — Core Web Vitals are a confirmed Google ranking signal as part of the page experience update. They are not the dominant ranking factor — content quality, relevance, and backlinks still carry more weight. But when two pages are otherwise similar in quality, better Core Web Vitals can be the tiebreaker. More practically, poor Core Web Vitals mean poor user experience, which increases bounce rate and reduces the time users spend on your site — both of which have indirect SEO effects.
Why does my PageSpeed score keep changing every time I test?
Lab test scores are inherently variable — they depend on server load at the moment of the test, network conditions of the testing tool’s server, and random variation in how long processes take. A single score is not meaningful. Run 3-5 tests and average the results, or better yet, focus on your Search Console field data which averages real user experience over 28 days.
My desktop score is great but mobile is failing — what should I do?
Focus on mobile first — Google primarily uses mobile field data for ranking. Mobile Core Web Vitals failure is almost always related to one of three things: the site not being truly mobile-optimised (layout shifts on small screens, elements too large for mobile viewports), images not being served at appropriate mobile sizes (serving a 1400px wide image to a 390px mobile screen), or JavaScript execution time being longer on lower-powered mobile devices. Test your site on an actual mobile device, not just in browser developer tools’ responsive mode.
How long does it take to see Core Web Vitals improve in Search Console after making fixes?
The Core Web Vitals report uses a 28-day rolling window of real user data. Changes you make today will start affecting the data immediately as new users visit, but because the window is 28 days, the full effect won’t be visible for 3-4 weeks. If you’ve made significant improvements, you should see the trend moving in the right direction within 2 weeks.
Can I pass Core Web Vitals with a page builder like Divi?
Yes — it’s entirely achievable. Divi 5 in particular has improved performance significantly. A Divi site on quality hosting with a properly configured LiteSpeed Cache or WP Rocket, optimised WebP images, and careful attention to render-blocking resources can and does pass all three Core Web Vitals in field data. The key is addressing the specific Divi considerations mentioned in this guide and testing on real devices, not just in PageSpeed Insights.
What’s the difference between Core Web Vitals and PageSpeed score?
The PageSpeed score (0-100) is a composite lab score calculated by Lighthouse. It incorporates Core Web Vitals metrics but also other metrics like Speed Index, Total Blocking Time, and Time to Interactive. Google does not use the PageSpeed score as a ranking signal — it uses the individual Core Web Vitals field data measurements. A site with a PageSpeed score of 65 can still pass Core Web Vitals in Search Console, and a site with a score of 95 can still fail Core Web Vitals if the real user experience is poor.
My site doesn’t have enough data in Search Console’s Core Web Vitals report — what do I do?
Google needs a minimum amount of field data from real Chrome users to generate a report. If your site doesn’t have enough traffic, the report will show “Not enough data.” In this case, use PageSpeed Insights lab data as your primary guide for optimisation. Focus on improving LCP, INP, and CLS scores in the lab — as your traffic grows and Search Console accumulates field data, the improvements should be reflected there. Increasing your site’s traffic through SEO and content is the indirect solution.
Good Core Web Vitals Are About Real People, Not Just Rankings
It’s easy to get caught up in scores, thresholds, and testing tools. But Core Web Vitals exist because Google recognised a simple truth: a page that loads slowly, jumps around while loading, and feels unresponsive to interaction is a bad experience. People leave. People don’t come back. And over time, pages that deliver poor experiences rank lower than pages that deliver good ones.
The good news for WordPress site owners is that most Core Web Vitals issues are fixable without touching code. Quality hosting, a well-configured caching plugin, properly optimised images, and a bit of attention to what’s loading when — these four things resolve the majority of Core Web Vitals failures on most WordPress sites.
Start with your hosting and caching. Fix your images. Then work through render-blocking resources and JavaScript in order. Check Search Console in 3-4 weeks. The improvements will show up in your field data — and eventually, in your rankings.