GA4 Does Not Have to Be Complicated
When Google switched everyone from Universal Analytics to Google Analytics 4 in 2023, a lot of website owners felt lost. The interface looked completely different. The reports they relied on were gone or renamed. Data that used to be easy to find required clicking through multiple menus to locate.
I went through the same adjustment period. GA4 is genuinely different from what came before, and the learning curve is real. But once you understand the logic behind how GA4 works, it becomes a powerful tool for understanding what is actually happening on your site — not just how many people visited, but what they did while they were there and whether your content is doing its job.
In this guide, I will take you through everything you need to know as a beginner. I will explain what GA4 tracks, how to set it up on your WordPress site, which reports are most useful, and how to make sense of the data without getting overwhelmed. If you run a WordPress site and want to understand your traffic, this is the starting point.
What Is Google Analytics 4?
Google Analytics 4, usually abbreviated as GA4, is Google’s current web analytics platform. It replaced Universal Analytics (UA), which was retired in July 2023. If you are starting fresh with analytics today, GA4 is what you will be using.
The core purpose of GA4 is to help you understand how people find your website, what they do when they get there, and whether they are taking the actions you want them to take — reading a post, signing up to a list, making a purchase, or sending an enquiry.
GA4 is built around an event-based data model. In Universal Analytics, the primary tracking unit was a session — a period of activity by a single user. In GA4, everything is an event. A page view is an event. A scroll is an event. A link click is an event. A form submission is an event. This shift makes GA4 more flexible and more detailed, but it also changes how you read and interpret the data.
- Traffic sources = Acquisition reports
- Top content = Pages & Screens report
- SEO keywords = Search Console integration
- Leads & enquiries = Conversions
GA4 vs Universal Analytics: What Changed?
If you used Universal Analytics before, understanding what changed helps you navigate GA4 more confidently. The most significant differences are:
- Sessions vs events — UA measured sessions as the primary unit; GA4 measures events. Page views, scrolls, clicks, and interactions are all events with associated parameters.
- Bounce rate replaced by engagement rate — GA4 does not report bounce rate in the traditional sense. Instead it reports engagement rate, which is the percentage of sessions that lasted longer than 10 seconds, had a conversion event, or had two or more page views. An engaged session is considered meaningful; a non-engaged session is equivalent to a traditional bounce.
- Users metric changed — GA4 defaults to reporting “active users” rather than total users. An active user is someone who had at least one engaged session. This often produces lower user counts than UA did for the same traffic.
- Cross-device and cross-platform tracking — GA4 is designed to track users across devices and platforms, including web and app. For most WordPress blog owners this does not change much in practice, but it is part of why the data model changed.
- No data sampling on free tier — GA4 removed data sampling for most standard reports, which means you are seeing actual data rather than estimates for most queries.
- Machine learning and predictive metrics — GA4 includes built-in predictive analytics like purchase probability and churn probability, though these are most relevant for eCommerce sites.
| Metric | Meaning |
|---|---|
| User | Individual visitor |
| Session | Visit |
| Event | Interaction |
| Engagement Rate | Quality of visit |
| Conversion | Goal completed |
How to Set Up GA4 on Your WordPress Site
Step 1: Create a Google Analytics Account
Go to analytics.google.com and sign in with your Google account. If you are new to Google Analytics, click “Start measuring” to create an account. If you already have an account from Universal Analytics days, you can add a new GA4 property to your existing account.
During account creation you will be asked for an account name (your name or business name works fine), then a property name (usually your website name), your time zone, and your currency. Set the time zone to your local time zone — this affects how daily data is segmented in your reports.
Step 2: Create a GA4 Property and Data Stream
After creating the account, you will set up a property. A property in GA4 represents your website (or app). Give it a recognizable name.
Next, you will create a data stream. Choose “Web” as the platform, enter your website URL and a stream name, and click Create. Google will generate a Measurement ID — it looks like G-XXXXXXXXXX. Keep this ID handy; you will need it for the next step.
Step 3: Add GA4 to WordPress
There are two reliable ways to add GA4 tracking to a WordPress site:
Option A: Using an SEO plugin (Rank Math) — In Rank Math, go to General Settings → Google Search Console → Google Analytics and paste your Measurement ID. Save changes. Rank Math injects the GA4 tracking code into your site automatically.
Option B: Using Google Site Kit plugin — Site Kit is Google’s official WordPress plugin. Install and activate it, then follow the setup wizard to connect GA4. Site Kit also connects Google Search Console and other Google products in one place. It is a good option for beginners who want a guided setup.
Option C: Adding the code manually — In GA4, go to Admin → Data Streams → your stream → View tag instructions. Google provides a code snippet that you add to the <head> of every page. In WordPress, you can do this through your theme’s header.php or through a plugin like Insert Headers and Footers. This is the most reliable method technically, but it requires slightly more comfort with WordPress.
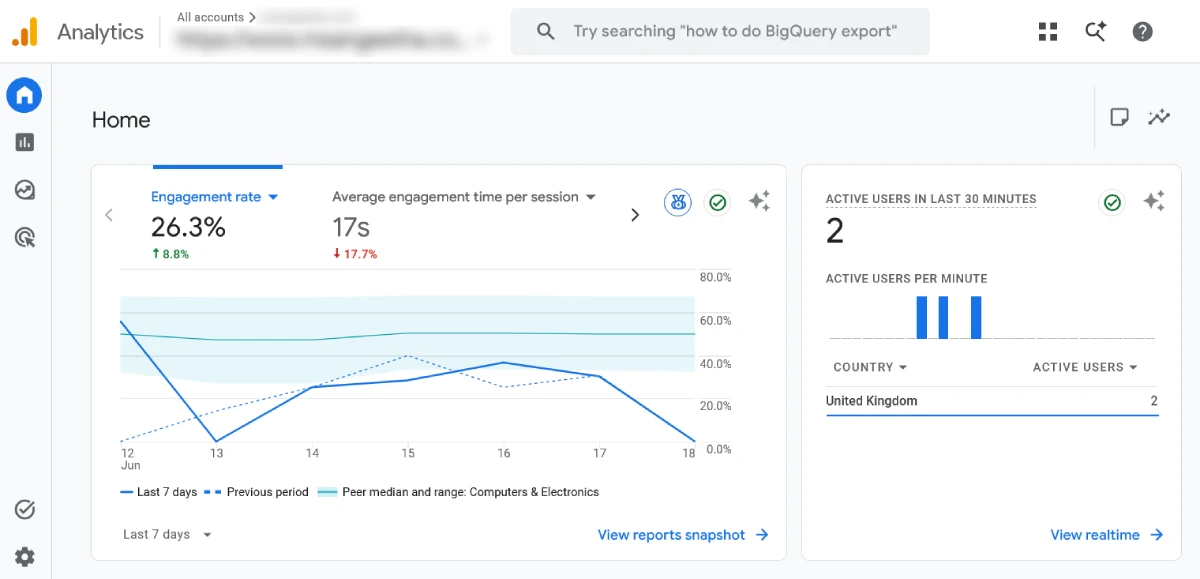
After adding the tracking code, go back to GA4 and check the Realtime report. Open your website in a new browser tab, and within a minute or two you should see yourself appear as an active user in the Realtime view. This confirms your tracking is working.
Step 4: Configure Basic Settings
Once tracking is confirmed, there are a few settings worth configuring before you start relying on the data:
- Exclude your own traffic — go to Admin → Data Streams → your stream → Configure tag settings → Define internal traffic. Add your IP address so your own visits do not inflate your numbers. Then go to Admin → Data Filters and activate the Internal Traffic filter.
- Enable Google Signals — go to Admin → Data Settings → Data Collection and enable Google Signals. This improves cross-device tracking and demographic reporting.
- Link to Google Search Console — go to Admin → Property Settings → Product Links → Search Console Links and connect your GSC property. This enables the Queries report in GA4 which shows which search terms drive traffic to your pages.
- Set your data retention period — go to Admin → Data Settings → Data Retention and change the retention period from the default 2 months to 14 months. This is important if you want to compare year-over-year data in custom reports.
Understanding the GA4 Interface
The GA4 left navigation is organized into these main sections:
- Home — a summary dashboard with recent metrics and insights
- Reports — where most of your day-to-day analysis happens
- Explore — custom reports and advanced analysis tools
- Advertising — attribution and conversion reporting (more relevant if you run paid ads)
- Admin — account, property, and data stream settings
The Reports section is where you will spend most of your time as a beginner. It is divided into report collections, and the default collections are:
- Life cycle — Acquisition, Engagement, Monetization, Retention
- User — Demographics, Tech
The Most Important GA4 Reports for WordPress Site Owners
1. Acquisition Overview
This report shows where your traffic is coming from. The main traffic channels in GA4 are:
- Organic Search — visitors who found you through a search engine
- Direct — visitors who typed your URL directly or came from a source that was not tracked
- Referral — visitors who clicked a link from another website
- Organic Social — visitors from social media platforms
- Email — visitors from email links
- Unassigned — traffic that GA4 could not categorize
Direct traffic is often misunderstood. A large direct traffic number does not necessarily mean people are typing your URL from memory — it often means GA4 could not determine where the visitor came from. I have written two posts that go deep on this specific topic: what direct traffic in GA4 actually means and how to reduce misattributed direct traffic in GA4.
2. Traffic Acquisition Report
Go to Reports → Acquisition → Traffic Acquisition. This report breaks down your sessions by channel, source, and medium. You can switch the primary dimension from “Session default channel group” to “Session source/medium” to see more specific data — for example, separating Google organic from Bing organic.
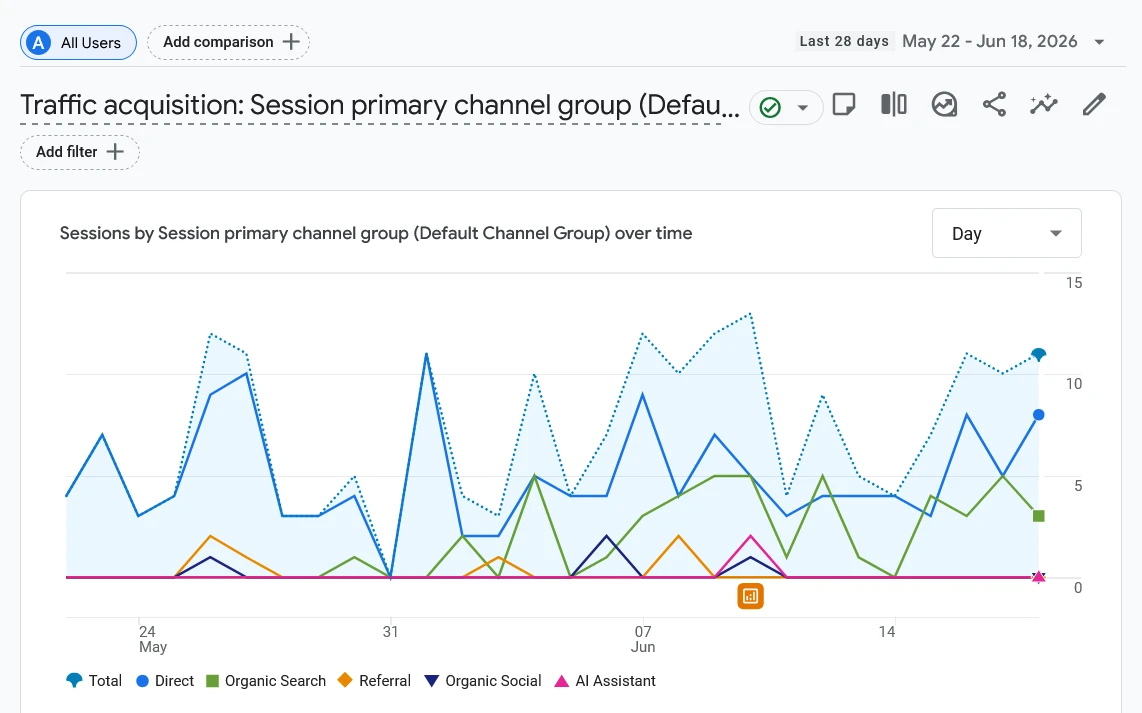
For a content-focused WordPress site, the metrics to watch here are:
- Sessions from Organic Search — is it growing over time?
- Engaged sessions — are organic visitors actually reading your content?
- Average engagement time — how long are people spending on pages from each source?
3. Pages and Screens Report
Go to Reports → Engagement → Pages and screens. This report shows which pages are getting the most views, how long people spend on each page, and how many engaged sessions each page receives.
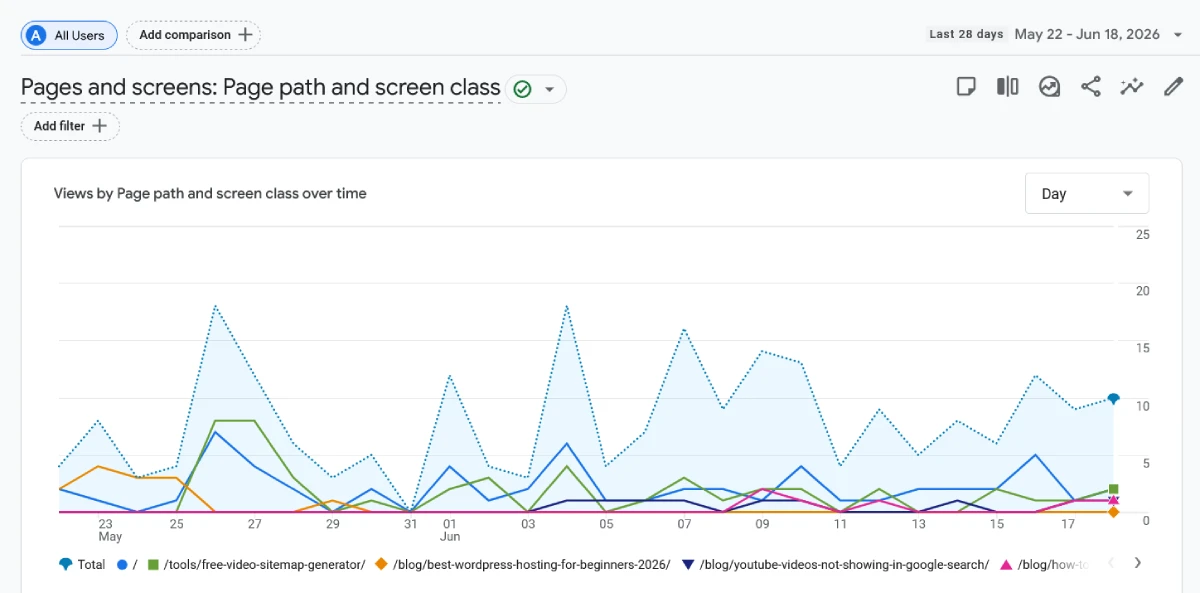
This is one of the most useful reports for a blogger. Sort by views to see your top-performing content. Sort by average engagement time to see which posts people are actually reading versus quickly leaving. A post with high views but low engagement time often means the content is not matching what the visitor expected — a signal to revisit the post structure or content quality.
If certain pages are getting traffic but not delivering results, I have a dedicated post on why your website gets traffic but no leads that addresses this exact pattern.
4. Landing Page Report
Go to Reports → Engagement → Landing page. This shows which pages visitors land on first when they arrive at your site. It is different from the Pages and Screens report, which counts all page views regardless of where in the session they occur.
The landing page report is important because it tells you which pages are doing the work of bringing people in. If a page gets lots of internal page views but almost no landing sessions, it is surviving on internal traffic — it may not be ranking or being discovered externally at all.
5. Search Console Queries Report
If you have linked GA4 to Google Search Console, you will find a Search Console collection in your Reports section. Under this, the Queries report shows the keywords that drove organic traffic to your site, along with clicks, impressions, CTR, and average position.
This is extremely valuable for keyword research and content planning. It shows you not just what you are ranking for, but which rankings are actually generating clicks versus which are getting impressions without clicks. A high-impression, low-CTR keyword is a strong signal to revisit your title tag and meta description.
6. Demographics and Tech Reports
These reports show who your visitors are (country, city, age, gender if signals data is available) and what technology they use (browser, device category, operating system, screen resolution).
The Tech report is particularly useful for identifying whether your audience is primarily on mobile or desktop. If the majority of your sessions come from mobile devices, that should inform your content formatting decisions. See my guide on blog post structure for SEO for formatting principles that work across devices.
7. Retention Report
Go to Reports → Retention. This report shows how many users return to your site over time. A high retention rate means people found your content valuable enough to come back. A low retention rate on an informational blog is normal — most visitors arrive for one post and leave — but a sudden drop in retention can signal a quality or technical issue worth investigating.
Key Metrics to Understand in GA4
These are the metrics you will encounter most often as a beginner, explained plainly:
- Users — the number of distinct individuals who visited your site in the selected period; GA4 defaults to active users
- Sessions — the number of visits; one user can have multiple sessions
- Engaged sessions — sessions that lasted more than 10 seconds, included a conversion, or had 2+ page views
- Engagement rate — the percentage of sessions that were engaged; higher is better; a healthy content site typically sees 50–70%
- Average engagement time per session — how long the average session lasted; for a blog this is a proxy for read depth
- Events — any recorded interaction; page views, scrolls, clicks, and custom events all appear here
- Conversions — events you have marked as important goals; by default GA4 marks no events as conversions until you configure them
- Views — total page views including repeat views of the same page in a session
Setting Up Conversions in GA4
A conversion in GA4 is any event you mark as a goal. By default, GA4 tracks many events automatically (page views, scrolls, outbound clicks, file downloads) but does not mark any of them as conversions.
To mark an event as a conversion, go to Admin → Events, find the event you want to track as a goal, and toggle on the “Mark as conversion” switch. Common conversions for a WordPress blog or service site include:
- Form submissions (contact form, lead form)
- Newsletter signups
- Clicks on a “Book a Call” or “Hire Me” button
- File downloads (PDF guides, checklists)
If a user visits your site but takes no conversion action despite reading multiple pages, that is a content-to-conversion gap worth analyzing. My post on why your website gets traffic but no leads covers how to diagnose and fix this pattern.
Using the Explore Section for Deeper Analysis
The standard Reports section covers the most common needs. The Explore section is for custom analysis that goes beyond what the default reports show. It includes several report types:
- Free form — a flexible drag-and-drop report builder where you choose your own dimensions and metrics
- Funnel exploration — tracks how users move through a defined sequence of steps on your site
- Path exploration — shows the sequence of pages users visit before or after a specific page
- Segment overlap — compares different user segments to find patterns
- User lifetime — shows the lifetime value and behavior of cohorts of users
For most beginner WordPress site owners, the standard Reports section is sufficient. Explore becomes valuable once you have a clear question that the standard reports cannot answer — for example, “what pages do visitors who submit a contact form typically visit before converting?”
GA4 and SEO: How Analytics Informs Your Content Strategy
GA4 does not directly affect your search rankings, but the data it provides should shape every content decision you make. Here is how I use GA4 data in my own SEO workflow:
Identifying underperforming content — Pages with high impressions (from Google Search Console) but low engaged sessions in GA4 often have a content quality or relevance issue. The page is ranking but not satisfying the visitor. This is the first place I look when a page is not converting traffic into results.
Finding high-potential pages — Pages with strong engagement time but low traffic are candidates for more targeted promotion or internal linking. Good content that nobody is finding yet is an opportunity, not a failure. My guide on internal links for SEO explains how to use internal linking to push traffic toward these pages.
Understanding audience device mix — If 70% of your traffic is on mobile, your content formatting, font sizes, and page structure need to be optimized for that audience. This connects directly to your Core Web Vitals performance on mobile.
Diagnosing traffic drops — When organic traffic drops suddenly, GA4 helps you identify which pages were affected and whether the drop correlates with a technical change, a Google update, or a seasonal pattern. If traffic is consistently low, see my post on why your website is not getting traffic.
Validating content clusters — For content I publish as part of a cluster strategy, I monitor whether the pillar post and spoke posts are collectively driving traffic growth over time. GA4’s traffic trend data by landing page makes this easy to track.
GA4 Alongside Other Analytics Tools
GA4 is the foundation of my analytics setup, but I use it alongside other tools for a more complete picture:
Google Search Console — GA4 tells you what happens on your site; GSC tells you how your site appears in search and which queries are driving traffic. They complement each other. The integration between the two (via the Search Console link in GA4 Admin) is one of the most valuable setups you can have.
Microsoft Clarity — Clarity is a free heatmap and session recording tool from Microsoft. It shows you visually where visitors click, how far they scroll, and where they drop off. I have written a setup guide for installing Microsoft Clarity on WordPress. GA4 gives you numbers; Clarity shows you behavior.
Bing Webmaster Tools — For understanding how your site performs beyond Google, Bing Webmaster Tools provides search performance data from Bing’s ecosystem. Using it alongside GA4 gives you channel-level visibility across both major search engines.
My Weekly GA4 SEO Review Process
- Check Landing Pages report.
- Identify pages losing traffic.
- Review engagement time.
- Compare with GSC queries.
- Update content if needed.
- Add internal links to promising pages.
Common GA4 Mistakes Beginners Make
- Not excluding internal traffic — if you visit your own site frequently without filtering your IP, your behavior inflates session counts and distorts engagement metrics
- Reading numbers without context — a drop in users is not always bad; if engagement time goes up and conversions hold steady, fewer but more relevant visitors may be a good sign
- Ignoring the date range — GA4 defaults to the last 28 days; always check the date range before drawing conclusions from any report
- Comparing GA4 data to old Universal Analytics data — the two platforms measure differently; direct comparisons are misleading
- Not setting up conversions — without marking any events as conversions, GA4 has no way to show you whether your site is achieving its goals
- Leaving data retention at 2 months — the default is too short for meaningful trend analysis; change it to 14 months immediately after setup
GA4 Topics I Cover in More Depth
This pillar post covers the foundations. I have also written dedicated posts that go deeper on specific GA4 topics:
Frequently Asked Questions
Is GA4 free to use?
Yes. GA4 is completely free for most websites. There is a paid version called Google Analytics 360 for enterprise-level needs, but the free version is sufficient for the vast majority of WordPress sites.
Do I need coding knowledge to set up GA4 on WordPress?
No. Using an SEO plugin like Rank Math or Google’s own Site Kit plugin, you can add GA4 tracking to WordPress without touching a single line of code. You only need your Measurement ID from the GA4 interface.
How long does it take for GA4 to show data?
Realtime data appears within seconds to minutes. Standard report data typically has a processing delay of 24 to 48 hours. Do not expect today’s data to be complete in the standard reports until the following day.
Why are my GA4 user numbers lower than my old Universal Analytics numbers?
GA4 reports active users by default, which counts only users who had at least one engaged session. Universal Analytics counted all users including those who immediately left. The change in definition is the most common reason for the apparent drop in numbers when switching platforms.
What is the difference between sessions and users in GA4?
A user is an individual visitor. A session is a single visit. One user can have multiple sessions — for example, if the same person visits your site on Monday and again on Friday, that is one user and two sessions. GA4 reports both metrics, and they serve different analytical purposes.
What happened to bounce rate in GA4?
GA4 replaced bounce rate with engagement rate. An engaged session is one that lasted more than 10 seconds, included a conversion event, or included two or more page views. The bounce rate in GA4 (shown in some reports) is simply the inverse of engagement rate — the percentage of sessions that were not engaged. It is measured differently from Universal Analytics bounce rate and should not be compared directly.
Can I use GA4 for a WordPress blog that is not a business?
Absolutely. GA4 is useful for any website, whether you are running a business, a personal blog, a portfolio, or a niche content site. Understanding which posts get traffic, how long people read, and where visitors come from helps you make better content decisions regardless of whether you are monetizing the site.
How do I see which keywords bring traffic in GA4?
Link your GA4 property to Google Search Console (Admin → Property Settings → Search Console Links). Once linked, a Search Console collection appears in your Reports section. The Queries report inside that collection shows the search terms driving organic traffic to your site.