
The GSC Core Web Vitals Report Looks Simple. Reading It Correctly Is Not.
The first time most WordPress site owners open the Core Web Vitals report in Google Search Console, it looks straightforward. A few colored bars, a chart over time, two tabs for Mobile and Desktop. How hard could it be?
Then they try to act on it. The report groups dozens or hundreds of URLs together by “similar pages,” shows a metric they have never heard of (INP, which replaced FID in 2024), and gives almost no specific guidance on what to actually fix. I have walked many clients through this exact confusion.
This report matters because it is the only place you can see your Core Web Vitals performance the way Google actually measures it — from real visitors using Chrome, not from a lab test. I covered the underlying metrics in detail in my Core Web Vitals guide. This post focuses specifically on how to read and act on the GSC report itself, which is a different skill from understanding the metrics in isolation.
If you have not set up Google Search Console yet, start with my GSC setup guide for WordPress first — the Core Web Vitals report only becomes available once your property is verified and Google has collected enough real-user data.
Where to Find the Core Web Vitals Report
In Google Search Console, the report is in the left navigation under Experience → Core Web Vitals. You will see two separate reports: Mobile and Desktop. Google treats these independently because user experience and performance often differ significantly between device types, and mobile-first indexing means your mobile scores carry more weight for ranking purposes.
Each report shows a summary chart of URLs categorized into three statuses, plus a trend graph showing how that count has changed over roughly the past 90 days to 16 months depending on data availability.
Understanding the Three Status Categories
Every URL Google has field data for gets sorted into one of three buckets:
- Good — the URL passes all three Core Web Vitals thresholds (LCP, CLS, and INP) at the 75th percentile of real user visits
- Needs Improvement — the URL passes some thresholds but not all; it is in a borderline zone
- Poor — the URL fails one or more thresholds significantly enough to be flagged as a poor experience
One important rule to understand: a URL group’s overall status is always set by its worst-performing metric. If a group has excellent CLS and LCP but poor INP, the entire group is labeled “Poor.” There is no averaging across the three metrics — one failing metric is enough to drag the whole status down. This is why fixing the single worst metric first usually produces the most visible jump in your overall numbers.
It also helps to know that only indexed URLs can appear in this report at all. If a page is not indexed yet, it will not show up here regardless of how fast it loads. If you are troubleshooting why a page is missing from this report, first confirm it is indexed using the Coverage report — see my why your page is not indexed guide if you suspect that is the actual issue.
The goal is simple to state and harder to achieve: get as many URLs as possible into the Good category, especially your highest-traffic pages. Google does not require 100% of your site to pass — it weighs page experience as one signal among many, and the impact scales with how many of your important pages are affected.
The Three Metrics Behind Every Status
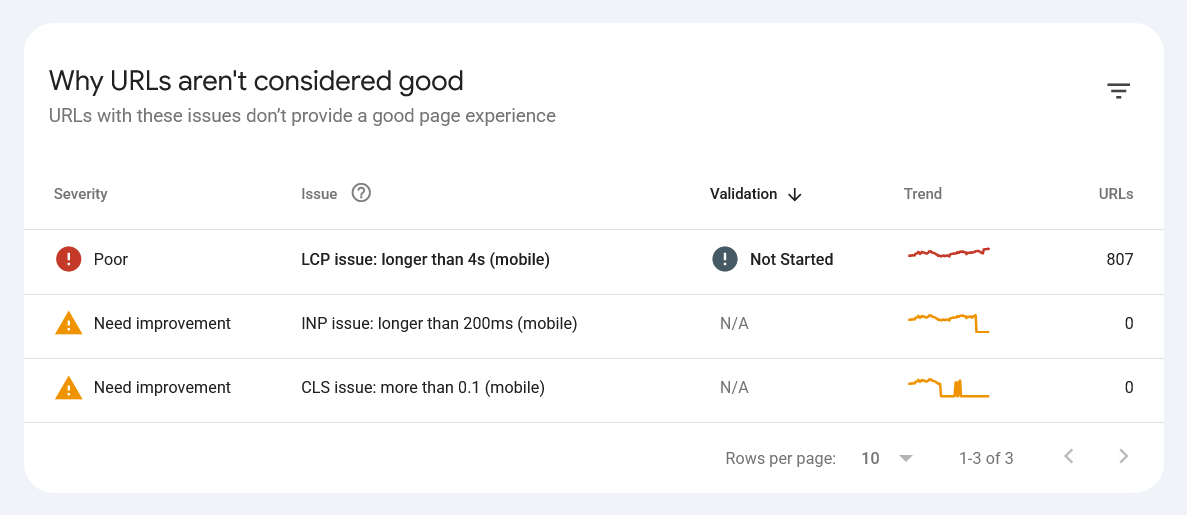
Each status above is determined by three underlying metrics. If a URL falls into Needs Improvement or Poor, the report tells you which specific metric is causing the failure.
LCP — Largest Contentful Paint
LCP measures how long it takes for the largest visible element on the page (usually a hero image, video thumbnail, or large block of text) to fully render. Google’s threshold for “Good” is 2.5 seconds or less, measured at the 75th percentile of page loads.
LCP issues are most commonly caused by slow server response times, large unoptimized images, render-blocking CSS or JavaScript, or slow third-party scripts loading before the main content. This is the metric most directly affected by caching, which is why a properly configured caching plugin matters so much. I compared two popular options in my WP Rocket vs LiteSpeed Cache post — both directly target LCP improvement through page caching and image lazy-loading.
One mistake I see often on WordPress sites: applying lazy-loading to the hero image itself. Lazy-loading is meant for images further down the page that load as the visitor scrolls. If you lazy-load the very image that qualifies as your LCP element, you delay its render instead of speeding it up, which makes the metric worse, not better. Make sure your hero or featured image is excluded from lazy-loading and ideally preloaded.
CLS — Cumulative Layout Shift
CLS measures visual stability — how much content shifts around as the page loads. Google’s threshold for “Good” is a score of 0.1 or less. A high CLS score usually means visitors experience the frustrating effect of trying to click something just as it moves, often because an ad, image, or embedded element loaded late and pushed content down.
Common WordPress causes of CLS issues include images without defined width and height attributes, web fonts loading late and causing text reflow, and dynamically injected content like cookie banners or ad units that do not reserve space in advance.
INP — Interaction to Next Paint
INP replaced FID (First Input Delay) as an official Core Web Vital in March 2024. It measures the responsiveness of your page to user interactions throughout the entire visit, not just the first interaction. Google’s threshold for “Good” is 200 milliseconds or less.
INP issues typically stem from heavy JavaScript execution that blocks the main thread, too many third-party scripts (analytics, chat widgets, ad scripts) competing for processing time, or complex page builder structures rendering excessive DOM elements. If you are on Divi or another heavy page builder, this is often the metric worth watching most closely, since builder-generated pages can carry more JavaScript and deeper DOM nesting than hand-coded HTML.
How to Read the URL Groups
This is the part that confuses most people. GSC does not list every individual URL with its own score. Instead, it groups similar URLs together — for example, all your blog posts using the same template might appear as a single “group” with a representative URL and a count of how many pages share that issue.
Click on any status row, and you will see a list of URL groups rather than individual pages. Click into a specific group to see example URLs within it. This grouping exists because Core Web Vitals issues are usually template-level or theme-level problems, not page-specific ones. If your blog post template has an LCP issue, every post built from that template will likely share the same issue.
Within each group, the example URLs are sorted by impressions, highest first. This matters for prioritization — the URL at the top of a group’s example list is the one carrying the most search visibility, so it is the one most worth checking first if you only have time to spot-check a handful of pages.
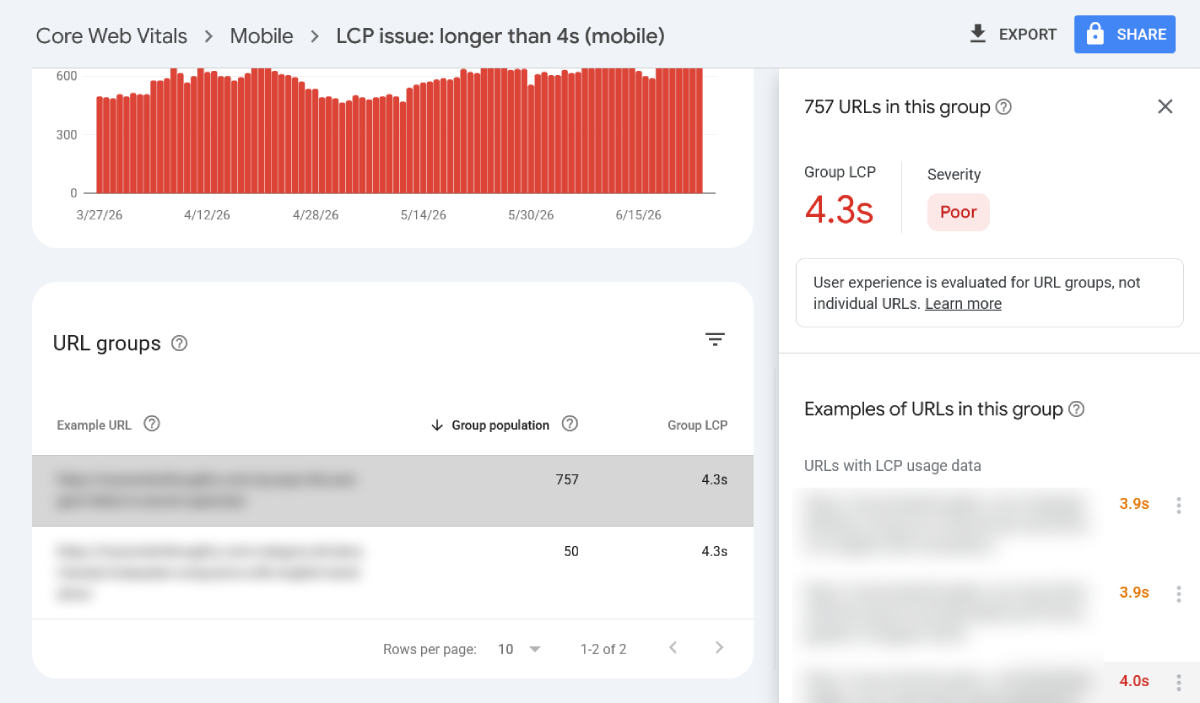
This is actually useful information: fixing one template-level issue often resolves the status for dozens or hundreds of URLs simultaneously. You rarely need to fix pages one by one.
Using the Validate Fix Feature
Once you believe you have fixed an issue, open the issue details page inside the Core Web Vitals report and click “Validate Fix” (sometimes labeled “Start Tracking”). This tells Google you want it to re-check the affected URLs.
Google runs an initial live test on the page, and if it detects a change consistent with a fix, it begins a validation period. This is not instant — because the report relies on the 28-day rolling CrUX window, full validation typically takes up to 28 days, though partial improvement can appear sooner as new field data accumulates. If validation fails, the issue reopens and you go back to investigating.
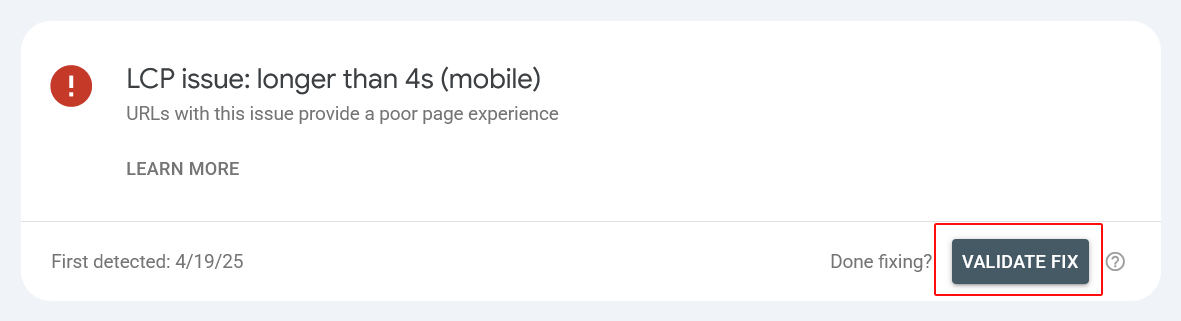
I recommend using this feature deliberately rather than ignoring it — it keeps a clear record of what you have already addressed versus what is still outstanding, which is especially useful when you are managing Core Web Vitals across a large site or multiple client properties.
Why the Report Sometimes Shows “Insufficient Data”
Not every URL on your site will have Core Web Vitals data. Google’s field data, called the Chrome User Experience Report (CrUX), only includes pages that receive enough real-world traffic from Chrome users who have opted into usage statistics. Low-traffic pages, brand new posts, or pages with very few visits may show no data at all.
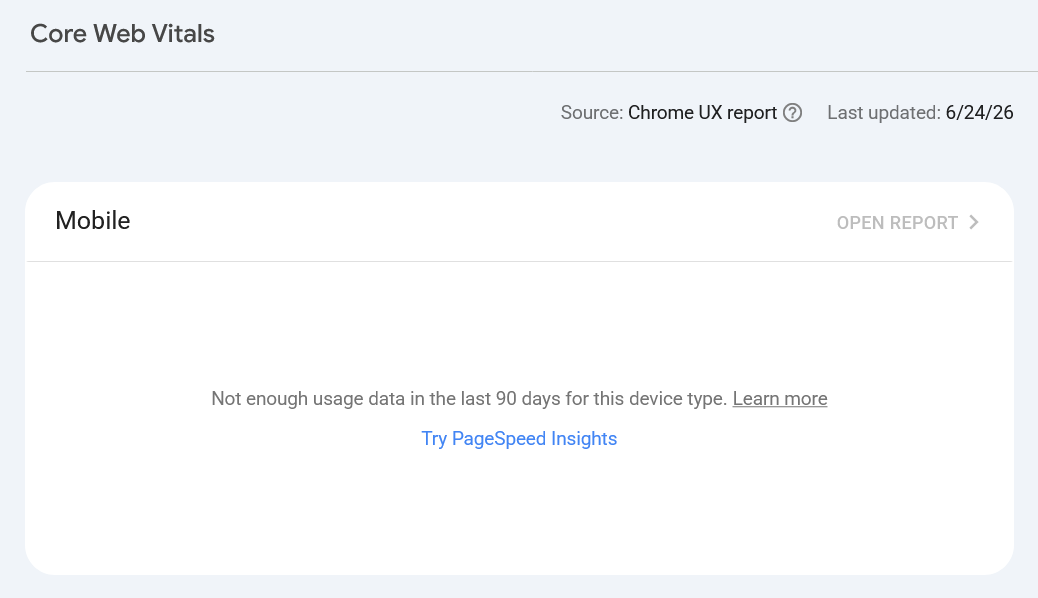
This means a freshly published post will not appear in the Core Web Vitals report immediately. It typically takes around 28 days of accumulated Chrome user data before Google has enough information to assign a status. Do not be alarmed if new content is simply absent from this report for the first few weeks — that’s normal, not a problem to fix. This is a related but separate concept from indexing status, which I explain in my GSC indexing status guide — a page can be fully indexed and ranking while still showing no Core Web Vitals data yet.
How Core Web Vitals Connects to Other GSC Reports
The Core Web Vitals report does not exist in isolation. I always cross-reference it with a few other reports when diagnosing performance issues:
Coverage report — if a large group of pages is flagged Poor for Core Web Vitals and those same pages are also struggling with indexing issues in the coverage report, that is a signal Google may be deprioritizing crawl and indexing resources for that section of your site due to a poor page experience.
Mixed content warnings — a page that is forcing browsers to load both HTTP and HTTPS resources can experience render delays. If you are seeing unexplained CLS or LCP issues alongside a mixed content warning, resolving the mixed content issue often improves both problems together.
Redirect chains — multiple redirect hops before a page finally loads add real latency that directly hurts LCP. If you suspect redirects are part of the problem, my guide on redirect loops and chains in WordPress explains how to find and fix them.
A Practical Workflow for Fixing Core Web Vitals Issues
Here is the process I follow when a client site shows Poor or Needs Improvement statuses in GSC:
- Identify the worst-performing URL group first — start with the group affecting the most URLs, since fixing a template-level issue resolves multiple pages at once
- Open one example URL in PageSpeed Insights — this gives you both lab data and field data, plus specific opportunities and diagnostics tied to that exact metric
- Address the specific failing metric — for LCP, check image optimization and caching; for CLS, check image dimensions and font loading; for INP, check JavaScript execution and third-party scripts
- Re-test after each change — make one change at a time where possible, so you know what actually moved the needle
- Click Validate Fix in GSC — once you are confident the issue is resolved, start the official validation tracking rather than just waiting silently
- Wait for field data to refresh — GSC’s field data updates on a rolling 28-day window, so improvements will not show in the report immediately even after the fix is live; check again in 2-4 weeks
As a general benchmark while you work through fixes, keep total page weight under roughly 500KB including all resources, and try to limit a single page to around 50 total resource requests (images, scripts, stylesheets combined). Pages well beyond these figures tend to struggle with LCP and INP regardless of how well-optimized the individual assets are.
This is also a core part of any broader technical SEO audit I run — Core Web Vitals findings rarely exist alone, and the underlying causes often overlap with crawl, caching, and indexing issues elsewhere on the site.
Does Core Web Vitals Actually Affect Rankings?
Yes, but proportionally, not dramatically. Google has confirmed Core Web Vitals are part of the page experience signals used in ranking, but they are one of many factors and tend to matter most as a tiebreaker between pages of otherwise similar relevance and quality. A page with poor Core Web Vitals but exceptional, highly relevant content will usually still outrank a fast page with thin or less relevant content.
That said, page experience compounds with other signals. A slow, visually unstable page also tends to have a higher bounce rate and lower engagement, which feeds into the broader quality signals Google considers. If a page is not getting indexed in the first place, performance becomes a secondary concern — see my post on why your page is not indexed if that is a more immediate issue for you.
Frequently Asked Questions
How often does the Core Web Vitals report update in GSC?
The report uses a rolling 28-day window of field data, and it typically refreshes every few days within Search Console. There can be a delay of several weeks between making a fix and seeing the status change, since enough new real-user data needs to accumulate to outweigh the older data in the rolling window.
Why does my site show “Good” in PageSpeed Insights but “Poor” in GSC?
PageSpeed Insights can show lab data, which is a simulated test run under controlled conditions, separately from field data, which reflects real users. GSC’s Core Web Vitals report uses only field data (CrUX). A page can score well in a single lab test while still showing real-world issues if actual visitors on slower connections or older devices experience worse performance than the lab simulation.
What is a good Core Web Vitals score to aim for?
The goal is for as many URL groups as possible to fall into the Good category — ideally LCP under 2.5 seconds, CLS under 0.1, and INP under 200 milliseconds, all at the 75th percentile of real visits. There is no single numeric “site score”; GSC reports status by URL group rather than an overall grade.
Can a caching plugin alone fix all my Core Web Vitals issues?
Caching plugins meaningfully help LCP and can assist with INP by deferring non-critical JavaScript, but they rarely fix CLS issues caused by missing image dimensions or late-loading fonts, since those are structural, not load-speed, problems. A complete fix usually requires a combination of caching, image optimization, and theme or page builder adjustments.
Why are some of my pages missing from the Core Web Vitals report entirely?
Pages need enough real-user traffic from Chrome for Google to collect sufficient CrUX data. Low-traffic or very new pages often show no data at all rather than a Good, Needs Improvement, or Poor status. This is expected and not something you need to troubleshoot.
Should I prioritize mobile or desktop Core Web Vitals first?
Mobile, in almost every case. Google uses mobile-first indexing, meaning your mobile experience carries more weight for ranking purposes, and most WordPress sites today receive the majority of their traffic from mobile devices. Fix mobile issues first unless your specific audience data shows desktop traffic dominates.